Google’s Core Web Vitals is coming in May 2021
To succeed in SEO you have to pay attention to the changes likely to make an impact on a website’s rankings and it is not very often Google let you know what they are doing. The fact that they have announced a release of “Google’s Core Web Vitals Update” which is to be released in May 2021 means we need to understand this change.
The fact that Google has given Digital Marketing consultants time to prepare is unprecedented.
Google Core Web Vitals report
The Gogole Core Web Vitals update is aimed at fixing poor user experiences on websites, to drive a positive change to the Internet. On The Google support page https://support.google.com/webmasters/answer/9205520?hl=en it explains the reasons behind this change.
- Longer page load times have a severe effect on bounce rates. For example:
- If page load time increases from 1 second to 3 seconds, bounce rate increases 32%
- If page load time increases from 1 second to 6 seconds, bounce rate increases by 106%
- Read case studies here.
In Google Search Console under enhancements there is now available “Core web Vitals”.
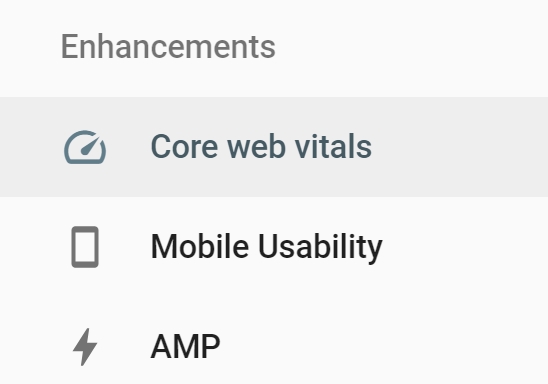
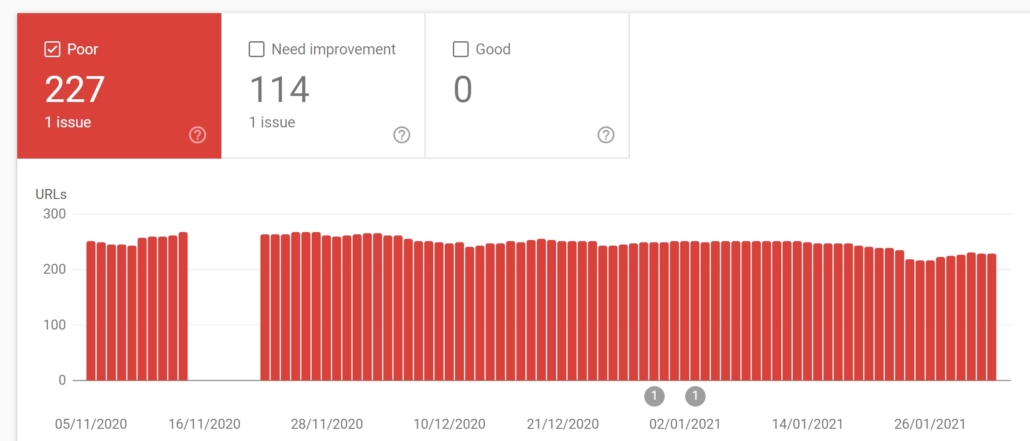
If you visit Google Search Console and take a look at a report you will find the issues now highlighted and an SEO Company can start to fix these. Interestingly when you look at the reports the data being captured goes back to November 2020, so it is clear that this drive for evaluating page experience for a better web has been fully active for some time now.
Google’s note on timing: “We recognize many site owners are rightfully placing their focus on responding to the effects of COVID-19. The ranking changes described in this post will not happen before next year, and we will provide at least six months notice before they’re rolled out. We’re providing the tools now to get you started (and because site owners have consistently requested to know about ranking changes as early as possible), but there is no immediate need to take action.“

It is important to to understand what is the main driver behind this core change and loading interactivity and visual stability is the main focus of this update in t4erms of search signals for page experience.
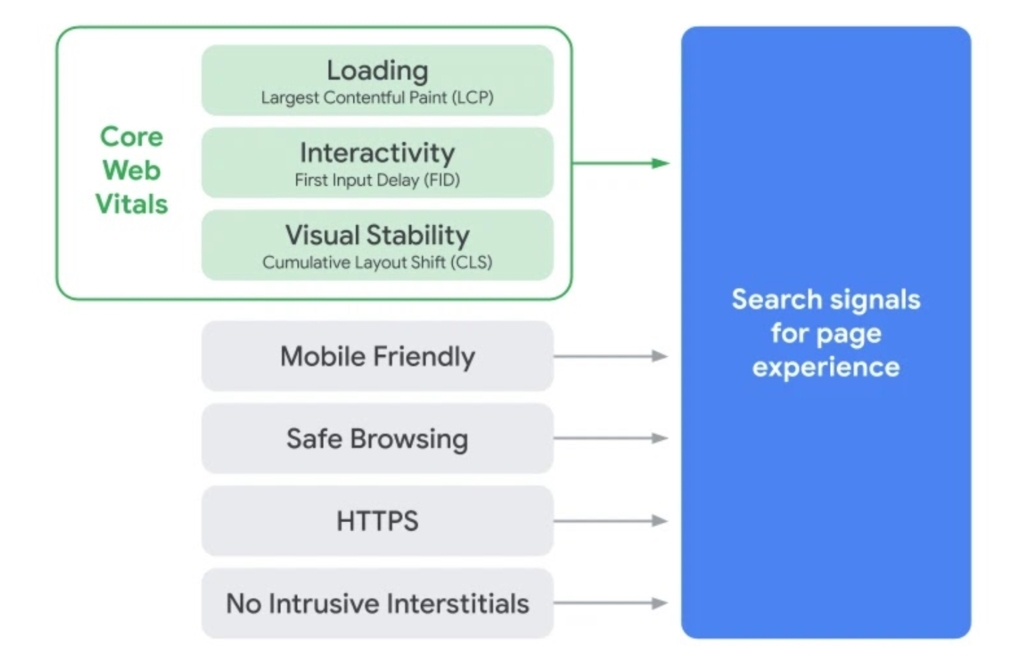
It is clear that Google has driven this change to force website owners to think about page experience including this as a core ranking factor. We believe this is a good move because the page experience of visitors enables people to get more done and engage more deeply with the website.
In contrast, a bad page experience could prevent a person being able to find the valuable information on a website. Google’s drive to force website owners to focus on page experience as part of the signals being used when the algorithm considers a websites worth to be included in search results means that website visitors will more easily be able to access the information they are looking for.
Google Core Web Vitals Report Data Sources
This new update is taking data for the Core Web Vitals report from the Chrome User Experience Report known as the CrUX report which provides user experience metrics for how real-world Chrome users experience websites.
The Chrome User Experience Report is powered by real user measurement of key user experience metrics across the public web, aggregated from users who have opted-in to syncing their browsing history, have not set up a Sync passphrase, and have usage statistic reporting enabled.
The data from the CrUX is made available via:
- PageSpeed Insights, which provides URL-level user experience metrics for popular URLs that are known by Google’s web crawlers.
- Public Google BigQuery project, which aggregates user experience metrics by origin, for all origins that are known by Google’s web crawlers, and split across multiple dimensions outlined below.
The CrUX report gathers anonymized metrics about performance times from actual users visiting your URL (called field data). The CrUX database gathers information about URLs whether or not the URL is part of a Search Console property. The metrics provided by the public Chrome User Experience Report hosted on Google BigQuery are powered by standard web platform APIs exposed by modern browsers and aggregated to origin-resolution. Site owners that want more detailed (URL level resolution) analysis and insight into their site performance and can use the same APIs to gather detailed real user measurement (RUM) data for their own origins.
We have been testing and found some strange issues with the results being detected. For example on a webpage that was loading qucik in a browser we ran the reports and foudn the issue to be:-
Reduce the impact of third-party code Third-party code blocked the main thread for 3,590 ms

This shows the issue to be Google Recaptcha software and the fact as CDN is used to speed up the website?
Minimize main-thread work 11.6 s
Consider reducing the time spent parsing, compiling and executing JS. You may find delivering smaller JS payloads helps with this.
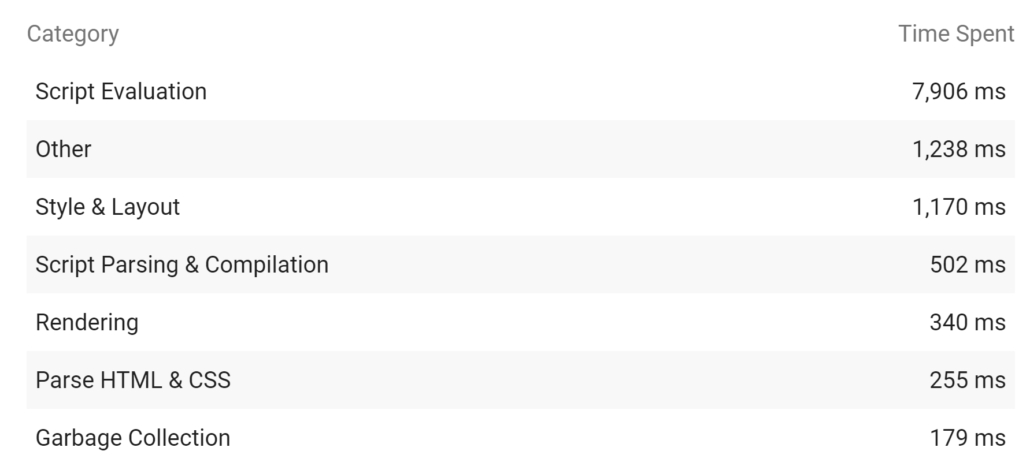
The website being test has Adsense on it and Google Analytics with very little scripting so the issue is something outside of the web developers control.
Reduce JavaScript execution time 8.2 s
Consider reducing the time spent parsing, compiling, and executing JS. You may find delivering smaller JS payloads helps with this.

So on investigation again this is Google’s recaptcha causing the issue!
Serve static assets with an efficient cache policy 18 resources found
A long cache lifetime can speed up repeat visits to your page.

So again on investigation the issue is Google Analytics and Recaptcha which a developer cannot control.
Avoid enormous network payloads Total size was 4,017 KiB
Large network payloads cost users real money and are highly correlated with long load times.

So investigation shows the issues again to be Google Recaptcha and Analytics which cannot be changed by a developer.
First Paint
Defined by the Paint Timing API and available in Chrome M60+:
“First Paint reports the time when the browser first rendered after navigation. This excludes the default background paint, but includes non-default background paint. This is the first key moment developers care about in page load – when the browser has started to render the page.”
First Contentful Paint
Defined by the Paint Timing API and available in Chrome M60+:
“First Contentful Paint reports the time when the browser first rendered any text, image (including background images), non-white canvas or SVG. This includes text with pending webfonts. This is the first time users could start consuming page content.”
DOMContentLoaded
Defined by the HTML specification:
“The DOMContentLoaded reports the time when the initial HTML document has been completely loaded and parsed, without waiting for stylesheets, images, and subframes to finish loading.” – MDN.
onload
Defined by the HTML specification:
“The load event is fired when the page and its dependent resources have finished loading.” – MDN.
First Input Delay
“First Input Delay (FID) is an important, user-centric metric for measuring load responsiveness because it quantifies the experience users feel when trying to interact with unresponsive pages—a low FID helps ensure that the page is usable.” – web.dev/fid/
Largest Contentful Paint
“Largest Contentful Paint (LCP) is an important, user-centric metric for measuring perceived load speed because it marks the point in the page load timeline when the page’s main content has likely loaded—a fast LCP helps reassure the user that the page is useful.” – web.dev/lcp/
Cumulative Layout Shift
“Cumulative Layout Shift (CLS) is an important, user-centric metric for measuring visual stability because it helps quantify how often users experience unexpected layout shifts—a low CLS helps ensure that the page is delightful.” – web.dev/cls/
Time to First Byte
“Time to first byte (TTFB) is a measurement used as an indication of the responsiveness of a webserver or other network resource. TTFB measures the duration from the user or client making an HTTP request to the first byte of the page being received by the client’s browser. This time is made up of the socket connection time, the time taken to send the HTTP request, and the time taken to get the first byte of the page.” – Wikipedia
Notification Permissions
Defined by the Notifications API and explained by MDN:
“The Notifications API allows web pages to control the display of system notifications to the end user. These are outside the top-level browsing context viewport, so therefore can be displayed even when the user has switched tabs or moved to a different app. The API is designed to be compatible with existing notification systems, across different platforms.” – MDN
Chrome will show users a prompt to grant the active website permission to show notifications when initiated by the website. Users can take actively or passively take one of four actions:
- Accept
- If the user has explicitly allowed the website to show them notifications.
- Deny
- If the user has explicitly disallowed the website from showing them notifications.
- Dismiss
- If the user closes the permission prompt without giving any explicit response.
- Ignore
- If the user does not interact with the prompt at all.
Dimensions
Performance of web content can vary significantly based on device type, properties of the network, and other variables. To help segment and understand user experience across such key segments, the Chrome User Experience Report provides the following dimensions.
Effective Connection Type
Defined by the Network Information API and available in Chrome M62+:
“Provides the effective connection type (“slow-2g”, “2g”, “3g”, “4g”, or “offline”) as determined by round-trip and bandwidth values based on real user measurement observations.”
Device Type
Coarse device classification (“phone”, “tablet”, or “desktop”), as communicated via User-Agent.
Country
Geographic location of users at the country-level, inferred by their IP address. Countries are identified by their respective ISO 3166-1 alpha-2 codes.
Data format
The report is provided via Google BigQuery as a collection of datasets containing user experience metrics aggregated to origin-resolution. Each dataset represents a single country, country_rs captures user experience data for users in Serbia (rs is the ISO 31611-1 code for Serbia). Additionally, there is a globally aggregated dataset (all) that captures the world-wide experience. Each row in the dataset contains a nested record of user experience for a particular origin, split by key dimensions.
| Dimension | |
|---|---|
origin | “https://example.com” |
effective_ | 4G |
form_ | “phone” |
first_ | 1000 |
first_ | 1200 |
first_ | 0.123 |
For example, the above shows a sample record from the Chrome User Experience Report, which indicates that 12.3% of page loads had a “first paint time” measurement in the range of 1000-1200 milliseconds when loading “http://example.com” on a “phone” device over a ”4G”-like connection. To obtain a cumulative value of users experiencing a first paint time below 1200 milliseconds, you can add up all records whose histogram’s “end” value is less than or equal to 1200.
Status: Poor, Need improvement, Good
The labels Poor, Needs improvement, and Good are applied to a URL on specific device type.
URL status
A URL’s status is the slowest status assigned to it for that device type. So:
A URL on mobile with Poor FID but Needs improvement LCP is labeled Poor on mobile.
A URL on mobile with Needs improvement LCP but Good FID is labeled Needs improvement on mobile.
A URL on mobile with Good FID and CLS but no LCP data is considered Good on mobile.
A URL with Good FID, LCP, and CLS on mobile and Needs improvement FID, LCP, and CLS on desktop is Good on mobile and Needs improvement on desktop.
If a URL has less than a threshold of data for a given metric, that metric is omitted from the report for that URL. A URL with data in only one metric is assigned the status of that metric. A URL without threshold data for either metric will not be on the report.
Status definitions
Status metrics are evaluated against the following boundaries:
Status definitions
Status metrics are evaluated against the following boundaries:
| Good | Needs improvement | Poor | |
|---|---|---|---|
| LCP | <=2.5s | <=4s | >4s |
| FID | <=100ms | <=300ms | >300ms |
| CLS | <=0.1 | <=0.25 | >0.25 |
- LCP (largest contentful paint): The amount of time to render the largest content element visible in the viewport, from when the user requests the URL. The largest element is typically an image or video, or perhaps a large block-level text element. This is important because it tells the reader that the URL is actually loading.
- Agg LCP (aggregated LCP) shown in the report is the time it takes for 75% of the visits to a URL in the group to reach the LCP state.
- FID (first input delay): The time from when a user first interacts with your page (when they clicked a link, tapped on a button, and so on) to the time when the browser responds to that interaction. This measurement is taken from whatever interactive element that the user first clicks. This is important on pages where the user needs to do something, because this is when the page has become interactive.
- Agg FID (aggregated FID) shown in the report means that 75% of visits to a URL in this group had this value or better.
- CLS (Cumulative Layout Shift): The amount that the page layout shifts during the loading phase. The score is rated from 0–1, where zero means no shifting and 1 means the most shifting. This is important because having pages elements shift while a user is trying to interact with it is a bad user experience.
- Agg CLS (aggregated CLS) shown in the report is the lowest common CLS for 75% of visits to a URL in the group.


